
Size and fit are still the number one reason shoppers send clothes back. Depending on the study, that number sits anywhere between 53% and 70% of all returns. If you run an e-commerce operation, you’ve probably already tried to fix this with the most common solution: a static size chart.
Size charts are an incredibly important resource for customers shopping for clothes online. However, there can be a lot of confusion as to what information to include in size charts and how to create them. Not only that, but solving for size and fit uncertainties needs to go beyond simple size charts.
In this article you’ll learn what size charts are, and exactly what a size chart can and can’t do, because that gap is where most of the return problem actually lives.
What Size Charts Actually Are
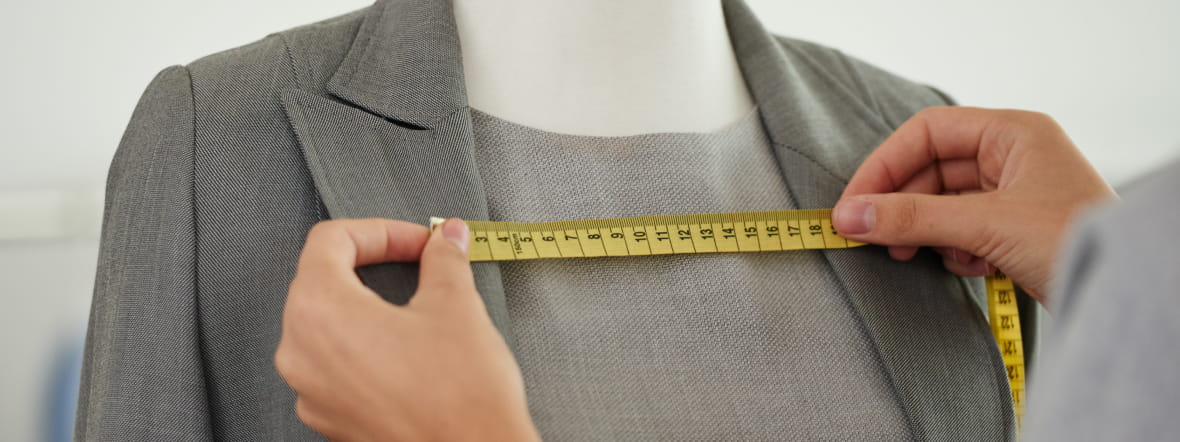
Size charts, also known as sizing guides or measurement tables, list a garment’s available sizes next to the body measurements each size is meant to fit. The idea is to give shoppers enough detail to match their body to a size label before they buy.
They earn their place on the product page for good reason. A size chart is cheap to build, fast to publish, and it does reduce some uncertainty. That’s exactly why it became the default across the industry. But it comes with real limits. Charts ask a lot of the shopper since they need to already know their own measurements, or be willing to grab a measuring tape and take them on the spot. Most people don’t do either. And even when a shopper measures correctly, a chart still can’t account for fit preference (loose versus fitted) or how a fabric behaves (stretchy versus stiff). Two people with identical measurements can want, and need, two different sizes.
A quick note on vocabulary: The chart on your product page is an external size chart, public-facing and built for shoppers. It’s different from an internal size chart, the confidential spec sheet brands use during manufacturing to keep sizing consistent across a production run. Internal charts are closely guarded because they capture the actual pattern, not just a simplified public version of it.
It also matters whether a chart lists body measurements or garment measurements. Garment measurements describe the item itself, while body measurements describe the person wearing it. The difference sounds small until you consider a pair of leggings as an example. The garment measurements of a pair of leggings will be much smaller than the legs they’re meant to fit, because the fabric stretches. Body measurements give shoppers a far more reliable read, since they don’t require any guesswork about how a specific piece is designed to fit.
Read More: The Ultimate Guide to Clothing Size Charts for Fashion E-commerce
The Role of Size Charts in the Buying Journey

A size chart is usually the first thing a shopper checks before adding an item to the cart. But when the chart doesn’t give them enough confidence, they don’t stop and measure themselves properly. They guess. They compare the item to a similar brand they’ve bought before. Or they just leave the page.
That hesitation shows up downstream as cart abandonment, and it’s largely invisible in your analytics unless you’re specifically tracking exits on product pages with high return rates. It doesn’t look like a sizing problem in your dashboard. It looks like a conversion problem.
Why do shoppers abandon carts over sizing?
Because the decision feels risky and reversible only through hassle. Shoppers know that if they get it wrong, they’ll have to deal with a return or exchange later. Faced with that risk, many just don’t buy. The size chart didn’t fail because it was poorly designed, but because it was never built to remove that specific kind of doubt.
Read More: How to Reduce Cart Abandonment
The Structural Limitation of Traditional Size Charts

A size chart treats sizing as a matching problem between two numbers: a body measurement and a garment’s size label. That assumption breaks down constantly in real apparel.
Two pieces labeled “M” from the same brand can fit completely differently depending on the pattern. A skinny-fit pair of pants and a straight-fit pair of pants in the same numeric size will sit on the hip in entirely different ways. A top made with stretch fabric will behave nothing like the same size cut in a stiff, non-stretch material. None of that is captured in a body measurement table, because it relates to pattern making and not body measurements. It’s about how the garment was cut, how much ease was built into the design, how the fabric behaves once it’s on a body.
This is exactly what internal size charts, the manufacturing spec sheets we mentioned earlier, are built to capture. The external chart your shoppers see is a simplified public version of that knowledge, and simplification is where the accuracy gets lost. So when a shopper picks a size based on the chart alone, they’re making the decision with half the information. The half that actually determines whether the garment fits the way they expect lives in the pattern, not in the spreadsheet.
Faced with that gap, the obvious next move for most stores is to add technology on top of the chart, things like a fit quiz, a size recommendation tool, or something that promises to do the matching for the shopper instead of asking them to interpret a table themselves. That instinct makes sense. But automating a match doesn’t fix it if the match itself is still built on the same numbers.
Not All AI Applied to Size Charts Solves for Size Uncertainty

Most AI size recommendation tools work by collecting shopper inputs (height, weight, fit preference) and cross-referencing them against purchase and return history using some form of AI or machine learning.
This is genuinely better than a static chart. It’s also not the full fix most teams assume it is. A size recommendation tool is only as good as the fit data feeding it. If the system doesn’t know how a specific garment is actually cut, how much stretch the fabric has, or how the pattern behaves across sizes, it’s optimizing a recommendation on top of incomplete information. It might reduce error at the margins, but it’s still guessing at the same variable the chart could never solve: real fit. The tool feels smarter because it’s personalized and instant, but underneath, it’s often running the same body-to-label comparison the chart always made, just faster.
Does a size recommendation tool with AI solve this on its own?
Not by itself. It improves accuracy over a static chart, but only if the underlying data reflects how each garment actually fits, not just the size label attached to it. Without that layer, the tool is still working with the same blind spot the chart had.
What Changes When a Team of Pattern Makers Builds the Technology
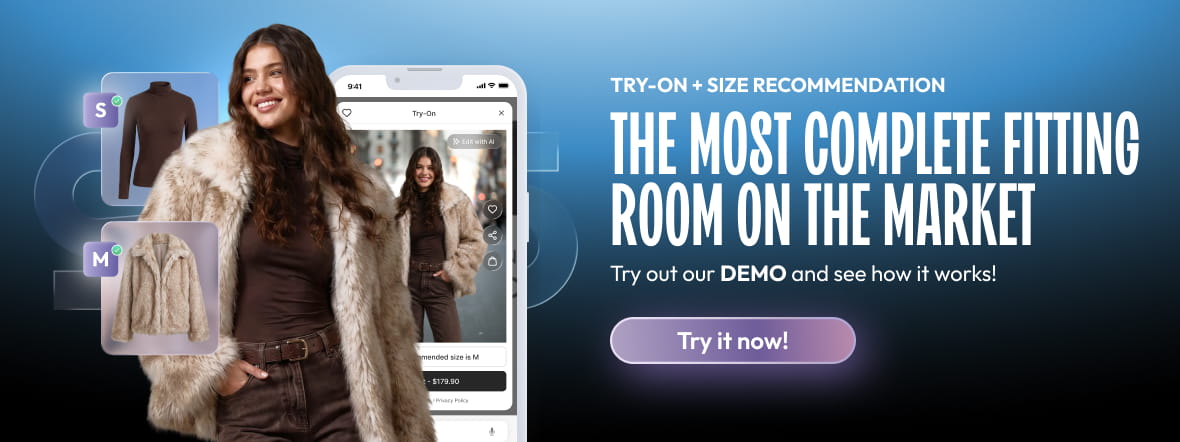
At Sizebay, we do things a little differently when it comes to size recommendation and virtual fitting rooms. Before a garment ever enters our recommendation and visualization system, an actual pattern maker evaluates its fabric, cut, and how the piece is meant to sit on the body. That analysis becomes part of the data our technology uses to generate a recommendation and to render how the piece will look and fit on the shopper.
In practice, this means the virtual fitting room is reflecting how the garment was actually constructed to fit, translated into a recommendation and a visualization the shopper can trust before checkout. That’s a structural difference, not a marketing claim. Software can be updated quickly. Pattern making expertise, the kind that catches the difference between an oversized cut and a true size run, takes years to build and can’t be shortcut with more data alone.
What does a pattern maker team actually change for the shopper?
It closes the exact gap that size charts and generic AI tools leave open. The recommendation isn’t just statistically likely to fit, it’s built on how the garment was actually designed to fit. That’s what shows up in our numbers: stores using our technology see up to 50% fewer returns and a 40% higher repurchase rate, because shoppers who get the right size the first time come back to buy again.
Direct Business Impact: What Changes in Practice for E-commerce?
For e-commerce teams, having a team of pattern makers behind your size recommendations isn’t an abstract improvement in customer experience. It shows up in the metrics you’re already tracking every week. When shoppers can see and trust how a garment will actually fit before they buy, hesitation drops and so does cart abandonment tied to sizing doubt. Stores using our Virtual Fitting Room see conversion rates up to 5 times higher on the products where it’s deployed, along with a 12% increase in average order value, since shoppers who feel confident about fit are also more open to adding a second item or trying a different style.
None of this comes from a better-looking size chart. It comes from giving the shopper a complete decision experience: a recommendation grounded in real modeling knowledge, paired with a visualization that shows how the piece will actually sit on their body.
Where Size Charts Still Fit In
The size chart still has a place on your product page. It’s a fast, low-cost reference point, and some shoppers will always want it. But if returns are still eating into your margins, you need to fix what feeds the recommendation behind your size chart.
If you’re evaluating size recommendation technology and want to see what a pattern maker-built virtual fitting room looks like in practice, that’s exactly what we do at Sizebay. Schedule a demo today to see what our solutions can do for your store.